Bem vindos ao Fórum do Portal BolsaPT! Inscrevam-se e participem na nossa comunidade, poderão pedir opiniões e Análises Técnicas às vossas acções, colocar dúvidas, aprender, partilhar ideias, ajudar outros, etc. Além das cotações, gráficos, análise técnica interactiva, históricos, terão simulação de carteiras, alarmes, e muito mais virá no futuro. Lembre-se que se pode logar com o seu login CanalForex!
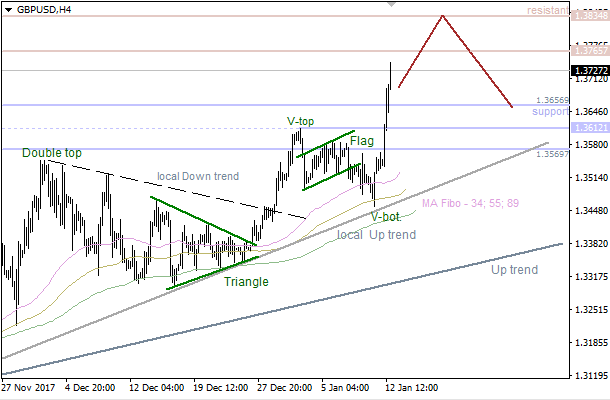
The main trend is still bullish. It's likely that the pair is going to test the next resistance at 1.3765 - 1.3834 in the short term. However, if a pullback from this area happens little later on, there'll be an opportunity to have a bearish correction towards the nearest support at 1.3635.
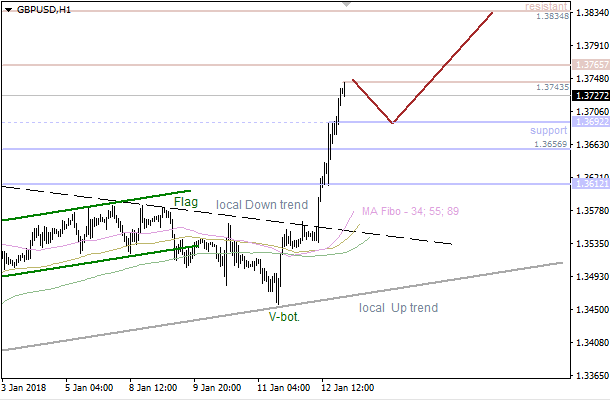
The pair faced with resistance at 1.3765, so bears are likely going to test the closest support at 1.3692 - 1.3656 in the coming hours. Meanwhile, if a pullback from this area happens afterwards, we could have another upward price movement in the direction of the next resistance at 1.3765 - 1.3834.
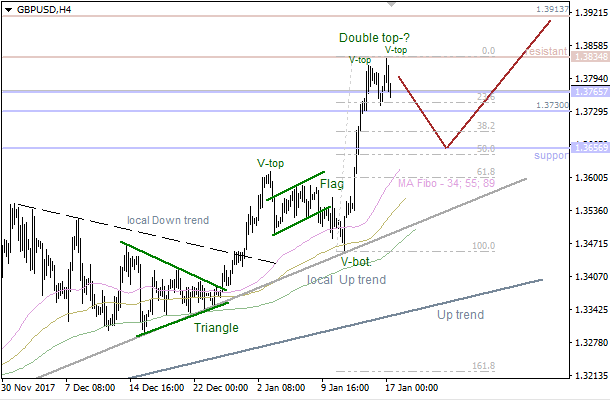
Sell 1.3730; SL 1.3750; TP1 1.3690.
Buy 1.3690; SL 1.3670; TP1 1.3830; TP2 1.3900.
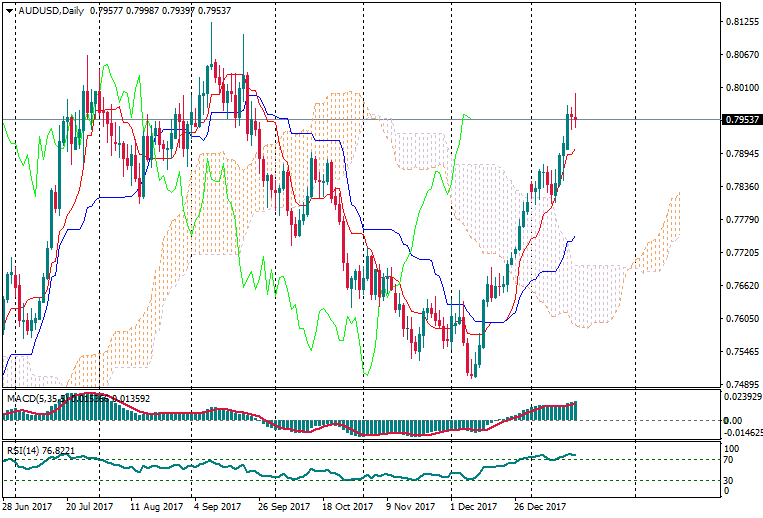
Reason: expanding bullish Ichimoku Cloud with rising Senkou Span A and B; a cancelled dead cross of Tenkan-sen and Kijun-sen with rising lines; the market is on new highs and overbought expected a correction.
Sell 111.00; SL 111.20; TP1 110.40; TP2 110.00.
Reason: expanding bearish Ichimoku Cloud with falling Senkou Span A and B; a dead cross of Tenkan-sen and Kijun-sen with falling lines; the prices reached new lows and the market is oversold.
On the daily chart, NZD/USD bulls managed to get above resistance at 0.7250-0.7265. Never the less, the fight for this important level continues. If the pair reaches 113% target of the Shark pattern, bears will be able to counterattack.
On H1, NZD/USD bulls keep controlling the situation. Sustainable uptrend allows traders to buy on the pullbacks to 23.6%, 38.2% and 50% ?of the wave CD of the Shark pattern
The price has been rising since a triangle in wave 4 was formed. The main intraday target for wave 5 of (C) is 7/8 MM Level, which could be a departure point for a bearish correction.
There's a developing upward impulse in wave 5. It's likely that wave [iii] is going to move on, so we should keep an eye on 5/8 MM Level as the next bullish target.
There's no any reversal pattern so far because all the last candles are bearish. In this case, the pair is likely going to test the lower "Window" in the short term.
The last bearish "Three Methods" pattern pushed the price lower. Also, there's no any bullish model, so the market is going to continue declining in the coming hours.
Sell 1.3760; SL 1.3780; TP1 1.3690; TP2 1.3650.
Reason: bullish Ichimoku Cloud with horizontal Senkou Span A and B; a golden cross of Tenkan-sen and Kijun-sen with horizontal lines; the market is under strong resistance and prices entered into the channel Tenkan-Kijun.
Sell 0.7940; SL 0.7960; TP1 0.7870; TP2 0.7840.
Reason: bullish Ichimoku Cloud with rising Senkou Span A and B; a golden cross of Tenkan-sen and Kijun-sen; but the market is overbought and under the strong resistance of 0.8000.
The main trend is still bullish, however there's a "V-Top" pattern, so the market is likely going to test the nearest support at 1.2225 - 1.2164. If a pullback from this area happens little later on, there'll be an opportunity to have another upward price movement.
We've got a "V-Top", so there's a developing bearish correction. The main intraday target is the closest resistance at 1.2272 - 1.2296. This area could be a departure point for a decline in the direction of the 55 Moving Average.
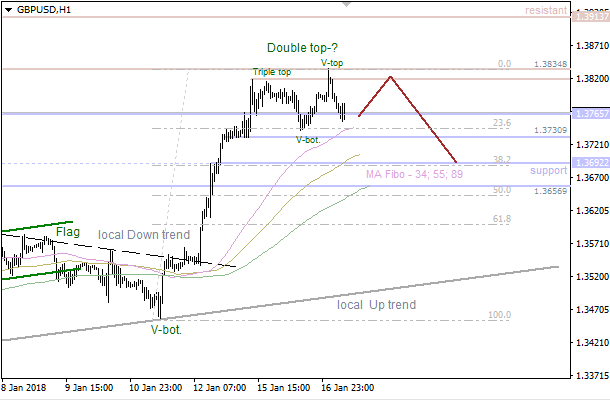
Bulls faced with resistance at 1.3834, so there's a "V-Top" pattern. In this case, we should keep an eye on the closest support at 1.3730 as the next bearish target. If a pullback from this level happens, there'll be a moment to have a bullish price movement towards the nearest resistance at 1.3834 - 1.3913.
The price is consolidating between the levels 1.3843 - 1.3765. The main intraday target is the next resistance at 1.3819 - 1.3834. Meanwhile, if a pullback from this area happens, there'll be an opportunity to have a decline towards the closest support at 1.3730 - 1.3692.