Bem vindos ao Fórum do Portal BolsaPT! Inscrevam-se e participem na nossa comunidade, poderão pedir opiniões e Análises Técnicas às vossas acções, colocar dúvidas, aprender, partilhar ideias, ajudar outros, etc. Além das cotações, gráficos, análise técnica interactiva, históricos, terão simulação de carteiras, alarmes, e muito mais virá no futuro. Lembre-se que se pode logar com o seu login CanalForex!
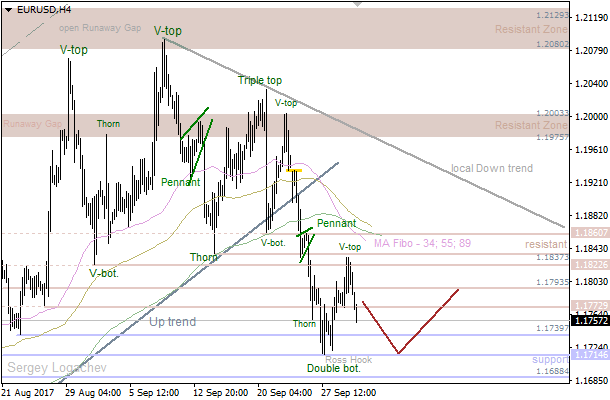
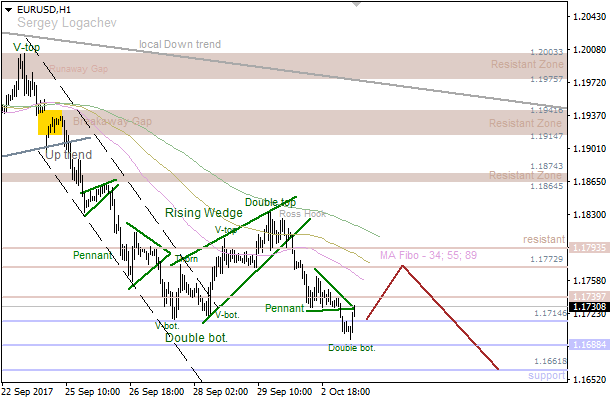
There's a "V-Top" pattern, so the price reached the nearest support at 1.1772. In this case, the market is likely going to continue declining towards the next support at 1.1739 - 1.1714. If a pullback from this area happens, we could have an upward correction in the direction of the closest resistance at 1.1772 - 1.1793.
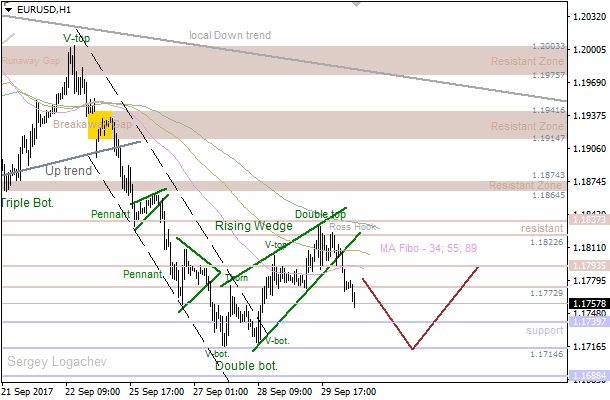
We've got an upward "Wedge", which has been broken, so the price is declining. Therefore, we should keep an eye on the nearest support at 1.1739 - 1.1714 as an intraday target. However, we have a pullback from these levels, there'll be an opportunity to see a bullish price movement towards the closest resistance at 1.1772 - 1.1793.
GBP/USD: MOVING AVERAGES ACTED AS RESISTANCE
07:52 02.10.2017
The price is consolidating in a range of the developing "Wedge". So, the upper side of this pattern is likely going to be broken soon. The main intraday target is the nearest resistance at 1.3479 - 1.3533, which could be a departure point for another decline.
The Moving Averages have acted as resistance, so the price is declining. Meanwhile, if we see a pullback from the nearest support at 1.3328, bulls are likely going to break the local uptrend. If so, the price could achieve the closest resistance at 1.3404 - 1.3444.
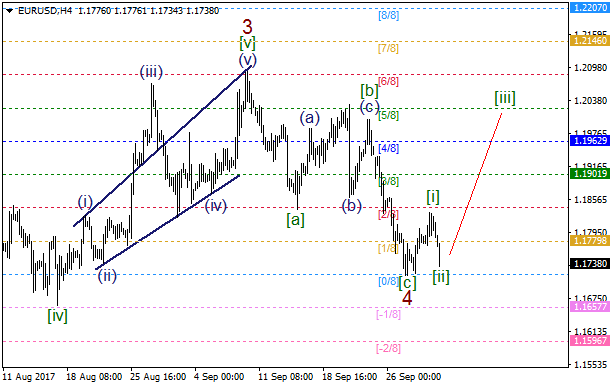
EUR/USD: PULLBACK FROM 0/8 MM LEVEL
08:22 02.10.2017
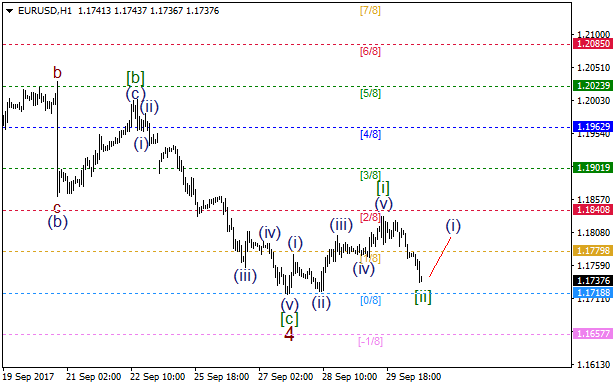
Wave 4 has been finished, cause there's a pullback from 0/8 MM Level. Also, there's an upward impulse in wave [i], so we've got developing wave [ii], which is about to end. In this case, we're likely going to have another upward impulse in wave [iii] of 5 soon.
There's a local decline, which could be wave [ii]. However, this bullish wave count will be unconfirmed until a bullish impulse in wave (i) arrives.
EUR/USD: "SHOOTING STAR" AT THE LOCAL HIGH
11:56 02.10.2017
There's a "Shooting Star", which has been formed at the last local high. This pattern has been confirmed, so the pair is likely going to decline towards the nearest support level.
The last bearish "Three Methods" pattern led to the current decline. Also, there isn't any reversal pattern so far. In this case, the market is likely going to continue moving down during the day.
USD/JPY: "HAMMER" ON 34 MOVING AVERAGE
11:58 02.10.2017
The 34 Moving Average has acted as support, so we've got a "Hammer" in this line. Therefore, bulls are likely going to test the upper "Window" in the short term. If a pullback from this level happens later on, we could have a downward correction.
There's a bearish "Engulfing", which has been formed at the last local high. So, there's an opportunity to have a downward correction in the coming hours. If a pullback from the 55 Moving Average arrives afterwards, bulls will probably try to deliver another upward price movement.
On the daily chart, XAU/USD went to an important support at $1267.6 an ounce. If bears manage to conquer it, risks of continuation towards the lower border of uptrend channel will significantly increase. On the other hand, recoil to the downside will allow consolidation in the $1265-1315 range.
On H1, XAU/USD is heading towards $1254. Near it theres a lower border of the downtrend channel, 224% target of AB=CD and historic support. This increases the risks of a pullback.
USD/CAD: LOONIE IS BREAKING THE TREND
07:38 03.10.2017
Recommendation:
BUY 1.2595
SL 1.254
TP1 1.2715 TP2 1.292 TP3 1.325
On the daily chart, USD/CAD bulls managed to overcome resistance at 1.2462. If they manage to conquer 1.2717 with ease, the odds of triggering the Shark patter will significantly increase. Its 88.6% target corresponds to 1.3250.
On H1, increase above resistance at 1.2533 will open the way to 1.2595 (88.6% of the last descending wave + 161.8% target of AB=CD). A successful test of this level will allow bulls to continue the rally.
GBP/USD: POUND BOUNCED FROM SSBS
07:38 03.10.2017
Technical levels: support 1.3250/80; resistance 1.3340, 1. 3410.
Trade recommendations:
Buy 1.3270; SL 1.3250; TP1 1.3340; TP2 1.3410.
Reason: narrowing bullish Ichimoku Cloud, but rising Senkou Span B; a dead cross of Tenkan-sen and Kijun-sen with the horizontal Tenkan-sen and Kijun-sen; the prices are reached the SSBs support and bounced inside Cloud.
AUD/USD: AUSSIE MAY RETURN TO CLOUD
07:39 03.10.2017
Technical levels: support 0.7800; resistance 0.7880, 0.7900.
Trade recommendations:
Buy 0.7820; SL 0.7800; TP1 0.7880; TP2 0.7900.
Reason: bearish Ichimoku Cloud with falling Senkou Span A and B; a dead cross of Tenkan-sen and Kijun-sen with falling lines; the prices are on the strong support on the daily timeframe.
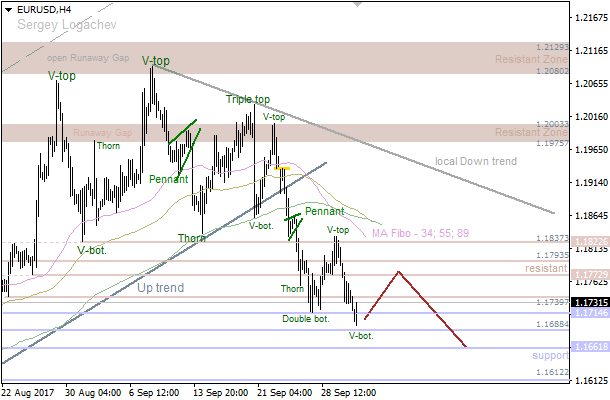
Bears faced with support at 1.1688, so we've got a "V-Bottom". In this case, the market is likely going to reach the nearest resistance at 1.1772 - 1.1793 in the coming hours. If a pullback from this area happens, we could have a decline towards the closest support at 1.1688 - 1.1661.
There's a "Double Bottom", which has been confirmed, so the price is likely going to reach the nearest resistance at 1.1772 - 1.1793 in the coming hours. If we see a pullback from these levels, there'll be an opportunity to have a downward price movement towards another support at 1.1688 - 1.1661.