Bem vindos ao Fórum do Portal BolsaPT! Inscrevam-se e participem na nossa comunidade, poderão pedir opiniões e Análises Técnicas às vossas acções, colocar dúvidas, aprender, partilhar ideias, ajudar outros, etc. Além das cotações, gráficos, análise técnica interactiva, históricos, terão simulação de carteiras, alarmes, e muito mais virá no futuro. Lembre-se que se pode logar com o seu login CanalForex!
On the daily chart, bulls are clinging to an important level of $1281 an ounce. Their failure will return the initiative to bears and increase the risks of decline to 78.6% and 200% targets of Gartley and AB=CD patterns.
On H1, XAU/USD keeps forming an inverted 5-0 pattern. Pullbacks to 50%, 38.2% and 23.6% of the wave CD are usually used for buying. A decline below support levels at $1271 and $1267 an ounce may be a signal for forming short positions.
On the daily chart, bulls manage to stay above support at 1.2460 and renew October low. As a result, the odds of the pair reaching 88.6% target of the inverted Shark pattern increased. Its situated near 1.3240.
On H1, USD/CAD broke above the upper border of the 1.2440-1.2555 consolidation range. This allowed bulls to form long positions. To continue the rally towards 224% target of AB=CD pattern, bulls need to keep the pair outside of the triangle.
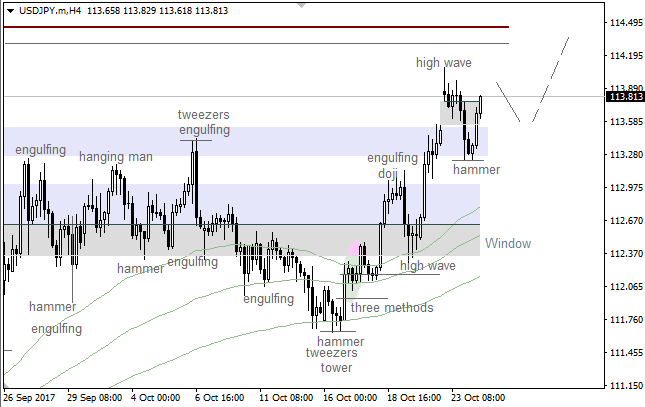
There are bullish patterns such a "Hammer" and an "Inverted Hammer", which both have been confirmed enough. So, the 55 Moving Average is likely going to act as resistance soon. If a pullback from this line happens, we could have another decline.
The last bullish "Harami" led to the current upward correction. Meanwhile, if a pullback from the 34 Moving Average happens little later on, there'll be an opportunity to have a local bearish correction towards the nearest "Window".
USD/JPY: NO ANY BEARISH PATTERN SO FAR
13:15 24.10.2017
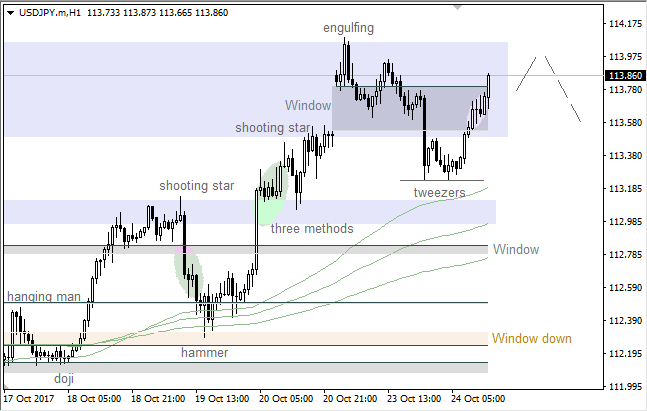
We've got a bullish "Hammer", which has been formed at the local low. Considering confirmation of this pattern, the market is likely going to reach the nearest resistance level. In this case, the last local high could be broken soon.
There's a bullish "Tweezers", which has been formed at the local low. Also, there's no any bearish pattern so far. So, the pair is likely going to continue moving up during the day.
EUR/USD: EURO READY TO GOING LOWER
05:39 25.10.2017
Technical levels: support 1.1730; resistance 1.1770.
Trade recommendations:
Sell 1.1750; SL 1.1870; TP1 1.1700; TP2 1.1680
Reason: narrow bearish Ichimoku Cloud, but horizontal Senkou Span A and B; a strong dead cross of Tenkan-sen and Kijun-sen with falling Tenkan-sen; the prices are tested the Clouds resistance and ready to continue a downtrend.
GBP/USD: POUND RETURNED TO MINIMUMS OF LAST WEEK
05:40 25.10.2017
Technical levels: support 1.3100; resistance 1.3150.
Trade recommendations:
Sell 1.3150; SL 1.3170; TP1 1.3100; TP2 1.3075.
Reason: expanding bearish Ichimoku Cloud with falling Senkou Span A and B; a weak golden cross of Tenkan-sen and Kijun-sen with horizontal lines; the prices are in negative area, below the Kijun-sen.
On the daily chart, USD/CHF completely formed the Dragon pattern. After it renewed the Dragon's head and quitted the descending trade channel, we are certain that bulls have the initiative. They unfolded the long-term trend and are ready to continue the rally at least until 224% target of AB=CD.
On H1, USD/CHF is forming «Spike and reversal with acceleration. As long as its staying above 0.9770-0.9800, bulls will remain control.
GBP/USD: BEARS WANT TO CONTINUE THE FEAST
06:45 25.10.2017
Recommendation:
SELL 1.3100
SL 1.3155
TP1 1.3 TP2 1.271
On the daily chart, inability of bulls to keep GBP/USD above 1.3175 points at their weakness. Bears are regaining the initiative and are ready to attack the lower border of the uptrend channel and trigger AB=CD pattern with the target at 200%.
On H1, the formation of the Widening wedge will allow expecting the pair to reach 113% target of a Shark pattern. To do this bears need a successful test of support levels at 78.6% and 88.6% of the wave 4-5.
There's a "Thorn" pattern, so the price is consolidating. The main intraday target is the nearest support at 1.1729 - 1.1719. If we have a pullback from this area, there'll be an opportunity to have an upward price movement towards the nearest resistance at 1.1793 - 1.1822.
Bears faced with support at 1.1757, but there's also resistance by the 34 Moving Average. If a pullback from this line happens, the market is likely going to test the next support at 1.1724 - 1.1719. This area could be a departure point for another bullish price movement towards a resistance at 1.1780 - 1.1793.
The Moving Averages have acted as resistance, so there's a "Double Top" pattern, which led to the current consolidation. It's likely that the pair is going to achieve the closest support at 1.3081 - 1.3026 during the day. If a pullback from these levels happens little later on, we could have a bullish price movement towards the next resistance at 1.3227 - 1.3258.
There's a bearish "Pennant", so the price is likely going to reach the nearest support at 1.3080 - 1.3073 during the day. If we have a pullback from this area, we should keep an eye on the next resistance at 1.3150 - 1.3169 as an intraday target.