Bem vindos ao Fórum do Portal BolsaPT! Inscrevam-se e participem na nossa comunidade, poderão pedir opiniões e Análises Técnicas às vossas acções, colocar dúvidas, aprender, partilhar ideias, ajudar outros, etc. Além das cotações, gráficos, análise técnica interactiva, históricos, terão simulação de carteiras, alarmes, e muito mais virá no futuro. Lembre-se que se pode logar com o seu login CanalForex!
Buy 0.7700; SL 0.7680; TP1 0.7760.
Sell 0.7670; SL 0.7690; TP1 0.7590; TP2 0.7540.
Reason: bearish Ichimoku Cloud with rising Senkou Span A; a new golden cross of Tenkan-sen and Kijun-sen; the prices returned to bottom border of the Cloud and may enter into cloudy area.
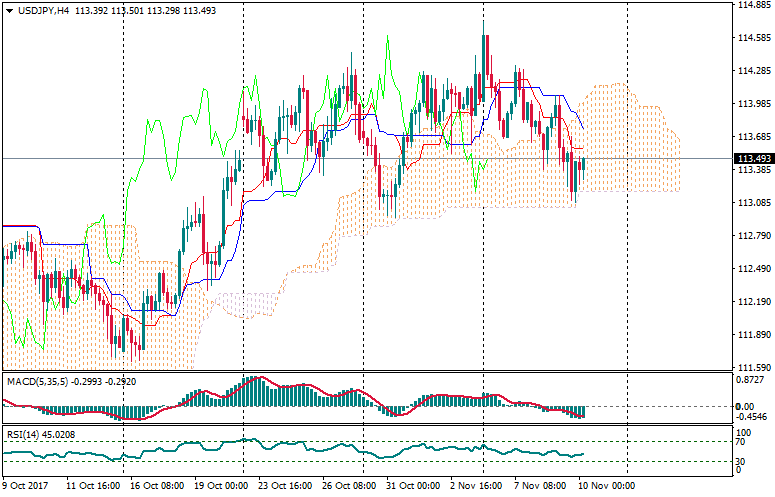
Technical levels: support 113.20; resistance 113.80.
Trade recommendations:
Buy 114.00; SL 113.80; TP1 114.40; TP2 114.80.
Sell 113.30; SL 113.50; TP1 112.40; TP2 112.20.
Reason: narrowing bullish Ichimoku Cloud with falling Senkou Span A; a dead cross of Tenkan-sen and Kijun-sen; the prices are tested the support of Senkou Span B and staying inside a Cloud.
On the daily chart, the pairs fate will depend on bulls ability to move the price towards resistance at 1.1695. In case of failure, the risk of reaching 200% target of AB=CD with the following formation of Wolfe waves pattern will increase. A break of resistance will create a ground for euros advance to $1.1750 and $1.1880. At these levels positions of sellers are strong.
On H1, the end of forming a Widening wedge doesn't guarantee a fast move through the diagonal resistance close to 1.1750. If bulls manage to conquer it, risks of realization of 113% target of the Shark pattern will increase.
On the daily chart, EUR/GBP is trying to break out of the medium-term descending channel. This is a bullish signal. Formation of the Double bottom pattern points at the uptrends resumption.
On H1, a break of resistance at 0.8940 and triggering of an inverted Ideal butterfly will increase the odds of reaching a 127.2% target. At the same time, in case of the break of 88.6% of the wave 4-5 a Widening wedge will be formed.
The price is consolidating under the 34 Moving Average. There isn't any reversal pattern, so we should keep an eye on the 89 MA as the next bullish target. If a pullback from this line arrives little later on, bears will probably try to deliver just another decline.
The 34 Moving Average is acting as support. Also, there's a bullish "Pennant" pattern, so the pair is likely going to reach the nearest resistance area at 1.3182 - 1.3205 during the day. If we see a pullback from these levels afterwards, there'll be a moment to have a downward price movement.
The 34 Moving Average has acted as resistance, so the price is consolidating. Meanwhile, the market is likely going to reach the next resistance at 1.1668 - 1.1695. If a pullback from these levels happens, we could have another decline towards the closest support at 1.1615 - 1.1582.
There's a "Pennant" pattern, so bulls are likely going to test the nearest resistance at 1.1668 - 1.1689 during the day. However, if a pullback from these levels happens, there'll be an opportunity to have a bearish price movement in the direction of another support at 1.1615 - 1.1601.
There isn't any reversal pattern, so the price is still rising. The main intraday target is the 89 Moving Average, which could be a departure point for another decline.
The 89 Moving Average has acted as support, so we've got a "High Wave" pattern, which was confirmed. In this case, the market is likely going to continue rising until any bearish pattern arrives.
There's a bullish "Harami", but confirmation of this pattern is a quite weak. So, if a pullback from the nearest resistance happens little later on, we could have just another decline.
The price is consolidating under the lower "Window". Previously, we have a bullish "Doji" pattern, which pushed the price higher. It seems like we're about to have another test of the Moving Averages, which could be a departure point for a decline towards the next "Window".
On the daily chart, NZD/USD is consolidating between 0.6820-0.7000 (October low and the lower border of the uptrend trade channel). A break of resistance at 0.7000 will return bulls hope for resuming the uptrend. On the other hand, successful test of support at 0.6820 will increase the risks of going to 127.2% and 161.8% targets of Crab pattern
On H1, aggressive market entries imply getting in on the break of the 0.6905-0.6990 range. According to the conservative approach, its necessary to wait for a break of a wider trading range 0.6820-0.7000.
On the daily chart, AUD/USD keeps consolidating within 0.7620-0.7735. A break of its upper border will open the way up to 0.7805-0.7820, 0.7860 and higher. On the other hand, successful test of support at 0.7620 will increase the odds of 113% target of the Shark pattern.
On H1, AUD/USD keeps forming Wolfe waves pattern. Aggressive entry implies long positions on the break of resistance at 0.7695. According to a conservative approach, one should wait for a test of diagonal resistance and (or) formation of the point 5 of the pattern Widening wedge.