Bem vindos ao Fórum do Portal BolsaPT! Inscrevam-se e participem na nossa comunidade, poderão pedir opiniões e Análises Técnicas às vossas acções, colocar dúvidas, aprender, partilhar ideias, ajudar outros, etc. Além das cotações, gráficos, análise técnica interactiva, históricos, terão simulação de carteiras, alarmes, e muito mais virá no futuro. Lembre-se que se pode logar com o seu login CanalForex!
Technical levels: support 1.3380; resistance 1.3500.
Trade recommendations:
Buy 1.3380; SL 1.3360; TP1 1.3470; TP2 1.3500.
Reason: expanding bullish Ichimoku Cloud, but horizontal Senkou Span A and B; a golden cross of Tenkan-sen and Kijun-sen; the market is in correction phase and may testing Kijuns support.
On the daily chart, NZD/USD is consolidating in the 0.6820-0.6980 range. A break of its lower border will increase the risks of kiwi going to 127.2% and 161.8% targets of a Crab. On the other hand, successful test of resistance at 0.6980 creates grounds for the pair going to 88.6% target of the Shark pattern.
On H1, a successful test of the neckline of the Head and Shoulders will allow the pair to continue its fall. On the other hand, going above 0.6930 will increase the odds of the rallys continuation.
On the daily chart, AUD/USD keeps fighting for the lower border of a long-term uptrend channel. If bulls fail to hold it, the risks of realization of 88.6% target of the senior Shark pattern will increase. On the other hand, a break of resistance at 0.7637-0.7640 will trigger the junior Shark.
On H1, AUD/USD after reaching 78.6% target of a Shark pulled back to 88.6%. The second attack of resistance at 0.7635 in case of success will allow bulls to count on the continuation of the rally.
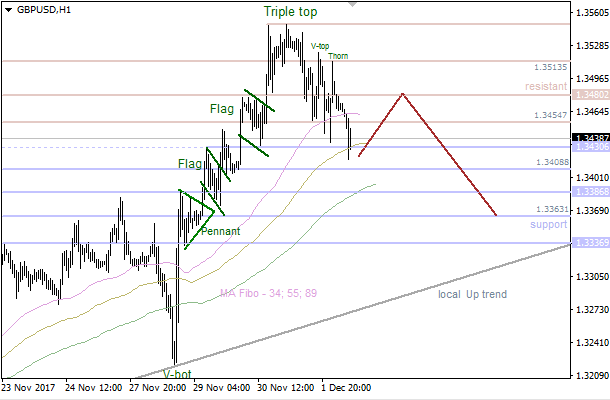
Bulls faced with resistance at 1.1934 - 1.1938, so there's a "Triple Top" pattern, which has been confirmed. Therefore, the market is likely going to decline towards the nearest support at 1.1808 - 1.1792 in the short term. If a pullback from this area happens little later on, we could have another upward price movement in the direction of the next resistance at 1.1909.
There's a "Triple Top" pattern, which has been confirmed by the last "Breakaway Gap", so the price has broken all the Moving Averages. However, bears faced with support at 1.1836. In this case, the pair is likely going to reach the closest resistance at 1.1897 - 1.1909 in the coming hours.
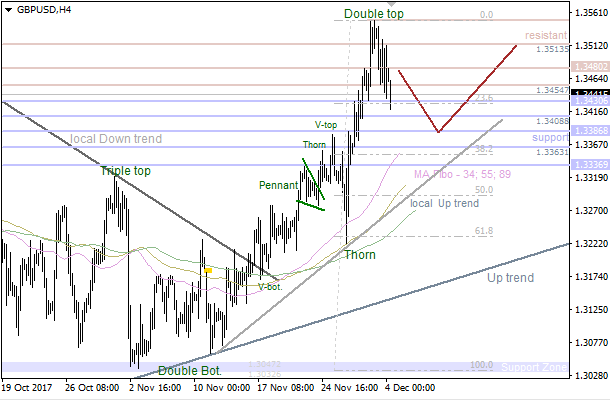
There's a "Double Top" pattern, which has been confirmed. So, the price is likely going to reach the nearest support at 1.3386 - 1.3363 in the coming hours. If a pullback from this area happens afterwards, there'll be an opportunity to have an upward price movement towards another resistance at 1.3480 - 1.3513.
The 55 Moving Average has acted as support, so bulls are likely going to test the 34 MA shortly. If a pullback from this line happens afterwards, bears will probably try to reach the nearest support between the levels 1.3386 - 1.3363.
The upper "Window" has acted as resistance once again. Also, there's new "Window". Therefore, the market is likely going to test the 89 Moving Average in the short term.
The 144 Moving Average is acting as support. Also, there's a bullish "Engulfing", but this pattern hasn't been confirmed yet. So, the pair is likely going to test the lower "Window" in the coming hours.
The price has been fixed above the "Window". Also, there isn't any reversal pattern so far. In this case, the price is likely going to continue moving up towards the next "Window".
There's a bearish "Engulfing", but this pattern hasn't been confirmed yet. So, we could have just a local correction and the following upward price movement afterwards.
On the daily chart, inability of bulls to conquer resistance at $1299-1302 an ounce with the following return of the price inside the $1266-1288 consolidation range points at buyers weakness. As a result, risks of the price reaching 78.6% and 200% targets of Gartley and AB=CD increased.
On H1, golds going outside of the short-term uptrend channel with the following retest of diagonal resistance confirms that bears are serious.
On the daily chart, USD/CAD formed a Shakeout-Fakeout pattern with a false break of an upper border of a triangle. As a result, the pair went outside of the uptrend channel. Such dynamics increases the risks of it sliding to 88.6% target of the Bat pattern.
On H1, USD/CAD is finishing a Widening wedge pattern. A pullback to 23.6% with the following return to point 5 means that bears are serious.
Buy 1.1890; SL 1.1870; TP1 1.1960; TP2 1.2000.
Sell 1.1850; SL 1.1870; TP1 1.1760.
Reason: bullish Ichimoku Cloud, but horizontal Senkou Span A and B; a weak golden cross of Tenkan-sen and Kijun-sen with the horizontal lines; the prices are under strong resistance of Kijun-sen and Senkou Span A.