Bem vindos ao Fórum do Portal BolsaPT! Inscrevam-se e participem na nossa comunidade, poderão pedir opiniões e Análises Técnicas às vossas acções, colocar dúvidas, aprender, partilhar ideias, ajudar outros, etc. Além das cotações, gráficos, análise técnica interactiva, históricos, terão simulação de carteiras, alarmes, e muito mais virá no futuro. Lembre-se que se pode logar com o seu login CanalForex!
We've got a "Shooting Star", which has been confirmed. Also, all the Moving Averages have been broken. In this case, the pair is likely going to test the nearest support area in the short term.
There are bullish patterns such an "Engulfing" and a "Harami". Therefore, the price is likely going to test the Moving Averages soon. If a pullback from these lines happens, there'll be an opportunity to have another decline.
On the daily chart, EUR/JPY there are Shakeout-fakeout and Spike and ledge patterns. Other tests of resistance at 133.95-134 or support at 131.50 will increase the risks of the pair getting to 200% and 88.6% targets of AB=CD and the Bat.
On H1, there are the Widening wedge and Wolfe waves. To resume the long-term uptrend the pair needs a successful test of resistance at 134. To develop correction the euro should break below 131.50.
On the daily chart, USD/JPY retraced 50% of the wave CD in line with the transformation of the Shark into 5-0. Another test of resistance at 113 in case of success will increase the odds of the rallys continuation towards 113% target of the senior Shark.
On H1, the junior Shark pattern is transforming into 5-0. To develop correction to the short-term downtrend with its following break bulls need to conquer resistance at 112.80-113 and at 113.25.
GBP/JPY Daily Analytics
09:14 07.12.2017
GBP/JPY reversed from resistance zone
Next sell target - 147.50
GBP/JPY continues to fall inside the minor impulse wave (i) which belongs to the C-wave of the intermediate ABC correction (B) from the middle of September. The active C-wave started earlier when the pair reversed down from the resistance zone lying at the intersection of the major resistance level 152.50, upper daily Bollinger Band the resistance trendline of the daily up channel from April. GBP/JPY is expected to fall to the next sell target at the next strong support level 147.50.
EUR/JPY Daily Analytics
09:13 07.12.2017
EUR/JPY reversed from resistance zone
Next sell target - 131.70
EUR/JPY recently reversed down from the resistance zone lying between the strong resistance level 134.50 (which reversed the previous upward waves (i) and (b), as can be seen below) and the upper daily Bollinger Band. The downward reversal from this resistance zone stopped the previous minor impulse wave i. EUR/JPY is expected to fall to the next sell target at the next support level 131.70 (which has been reversing the pair from the end of September).
Bears faced with support at 1.1772, so the price is consolidating. Nevertheless, the market is likely going to reach the next support at 1.1756 - 1.1734 in the short term. If a pullback from this area happens, there'll be an opportunity to have an upward price movement towards the next resistance at 1.1826 - 1.1859.
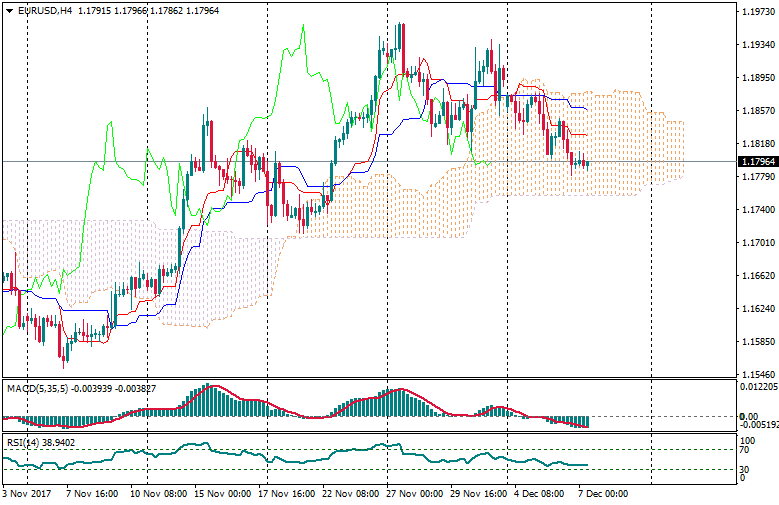
The price is consolidating between the levels 1.1772 - 1.1808. Also, there's a "Flag" pattern, so bears are likely going to test the closest support area at 1.1756 - 1.1734. Meanwhile, if a pullback from these levels happens, bulls will probably try to achieve another resistance at 1.1826 - 1.1836.
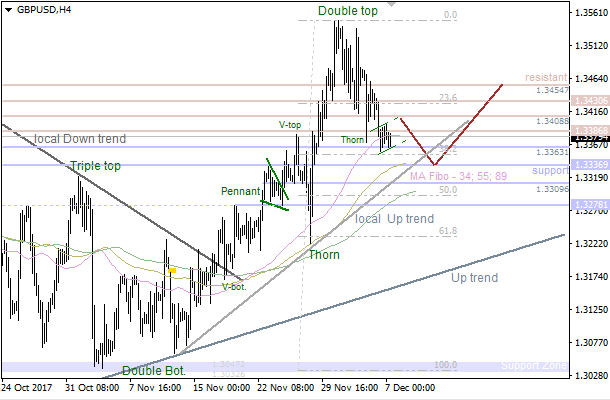
The price is consolidating along the 34 Moving Average. Considering that there's a "Double Top" pattern, the market is likely going to test the closest support at 1.3336. If a pullback from this level happens little later on, we could have an upward price movement towards the next resistance at 1.3430 - 1.3454.
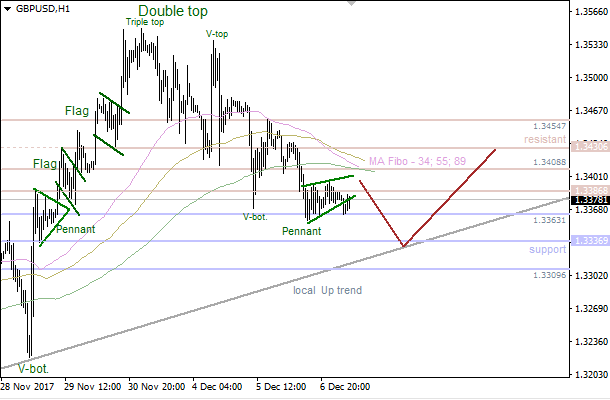
There's a "Pennant" pattern, so the pair is likely going to test the nearest support at 1.3336. However, if we have a pullback from this level, there'll be an opportunity to have a bullish price movement in the direction of the closest resistance at 1.3408 - 1.3430.
There's still no any reversal pattern, cause all the last candles are bearish. So, the pair is likely going to continue moving down towards the closest support area, which could be a departure point for another upward price movement.
We've got a bearish "Three Methods" pattern, which pushed the market lower. So, the price is likely going to continue declining until any reversal pattern forms.
The last "High Wave" pattern led to the current upward price movement. Meanwhile, if a pullback from the nearest resistance happens, we could have a downward correction towards the Moving Averages.
There's still no any reversal pattern, so bulls are likely going to test the upper "Window" in the coming hours. If a pullback from this level happens afterwards, there'll be an opportunity to have a bearish correction
Buy 1.1760; SL 1.1740; TP1 1.1820; TP2 1.1880.
Reason: bullish Ichimoku Cloud, but horizontal Senkou Span A and B; a dead cross of Tenkan-sen and Kijun-sen with falling Kijun-sen; the prices are on the strong support of Senkou Span B