Bem vindos ao Fórum do Portal BolsaPT! Inscrevam-se e participem na nossa comunidade, poderão pedir opiniões e Análises Técnicas às vossas acções, colocar dúvidas, aprender, partilhar ideias, ajudar outros, etc. Além das cotações, gráficos, análise técnica interactiva, históricos, terão simulação de carteiras, alarmes, e muito mais virá no futuro. Lembre-se que se pode logar com o seu login CanalForex!
There's a "Thorn" pattern, which has been formed under the 34 Moving Average. The main intraday target is the closest resistance at 1.3408 - 1.3454, which could be a departure point for another decline.
We've got a "Thorn" pattern, so the price is rising. Meanwhile, if a pullback from the nearest resistance at 1.3430 - 1.3447 happens, there'll be an opportunity to have a decline towards the closest support at 1.3360 - 1.3336.
The last "Piercing Line" pushed the price higher. All the Moving Averages have been broken, so the market is likely going to test the nearest resistance area, which could be a departure point for another decline.
There's resistance by the upper "Window", so we've got a bearish "Doji". Therefore, the price is likely going to test the Moving Averages during the day. If a pullback from these lines happens, bulls will probably try to test the last high.
There's a bullish "Hammer", which has been confirmed. So, if a pullback from the lower "Window" happens little later on, there'll be an opportunity to have an intraday upward price movement.
The price is consolidating inside the "Window". Also, we've got a bullish "High Wave", so the price is likely going to test the last high. If a pullback from this level happens, there'll be an option to have another decline.
On the daily chart, USD/CHF bears managed to lower the pair below important support at 0.9880-0.9890. They are focused on testing the lower border of an uptrend channel. The presence of a triangle means that to continue the way down the pair has to go below support at 0.9775.
On H1, to resume the rally bulls have to form a double bottom and then return the pair inside the uptrend channel.
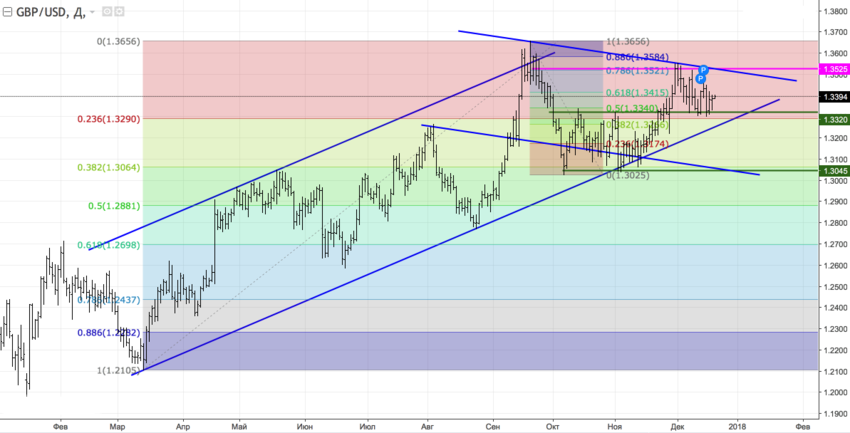
On the daily chart, GBP/USD bears for the third time tried to pull the pair below 1.3320 (upper border of the previous consolidation range). Formation of 2 inside bars points at the markets uncertainty. A break of their highs around 1.3215-1.3420 will increase the odds of the pairs advance.
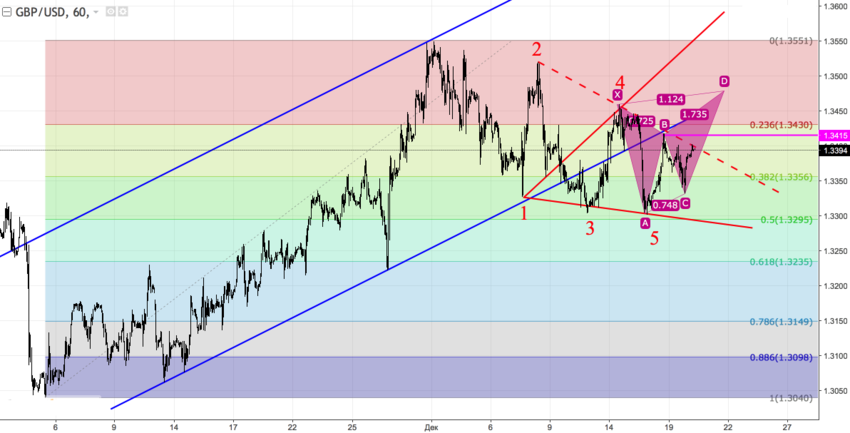
On H1, GBP/USD formed Wolfe waves pattern. A break of support at 1.3415 will trigger the Butterfly pattern and create grounds for a further rally.
Buy 1.1810; SL 1.1790; TP1 1.1880; TP2 1.1920.
Reason: narrowing bearish Ichimoku Cloud, rising Senkou Span A; a golden cross of Tenkan-sen and Kijun-sen with rising Tenkan-sen; the prices are tested the resistance of Senkou Span B and exit to the positive area.
Buy 1.3380; SL 1.3360; TP1 1.3450; TP2 1.3500.
Reason: narrow bearish Ichimoku Cloud with horizontal Senkou Span A and B; a weak dead cross of Tenkan-sen and Kijun-sen with narrowing channel of Tenkan-Kijun; the market in a positive area, on the strong support of Tenkan, Kijun and Senkou Span A.
Bulls faced with resistance at 1.1859, so the price is consolidating. The main intraday target is the next resistance at 1.1875 - 1.1884. If a pullback from this area happens, we could have a bearish correction towards the nearest support at 1.1833 - 1.1811.
The price has been consolidating since the downtrend was broken. It's likely that the pair is going to test the closest resistance at 1.1871 - 1.1890 in the short term. If a pullback from this area happens, there'll be an opportunity to have a downward correction.
The 89 Moving Average is acting as support, so the market is likely going to test the nearest resistance at 1.3454. If a pullback from this level happens, we could have a decline towards another support at 1.3369.
The price is consolidating above the Moving Averages. The main intraday target is the next resistance at 1.3430 - 1.3447, which could be a departure point for a downward price movement in the direction of the 89 Moving Average.
There's a "Shooting Star", which has been formed at the last local high. So, we're likely going to have a local bearish correction. However, if a pullback from the Moving Averages happens little later on, bulls will probably try to test the upper "Window".
We've got a "Shooting Star", which hasn't been confirmed yet. Nevertheless, bears are likely going to test the lower "Window", which could be a departure point for another upward price movement.