Bem vindos ao Fórum do Portal BolsaPT! Inscrevam-se e participem na nossa comunidade, poderão pedir opiniões e Análises Técnicas às vossas acções, colocar dúvidas, aprender, partilhar ideias, ajudar outros, etc. Além das cotações, gráficos, análise técnica interactiva, históricos, terão simulação de carteiras, alarmes, e muito mais virá no futuro. Lembre-se que se pode logar com o seu login CanalForex!
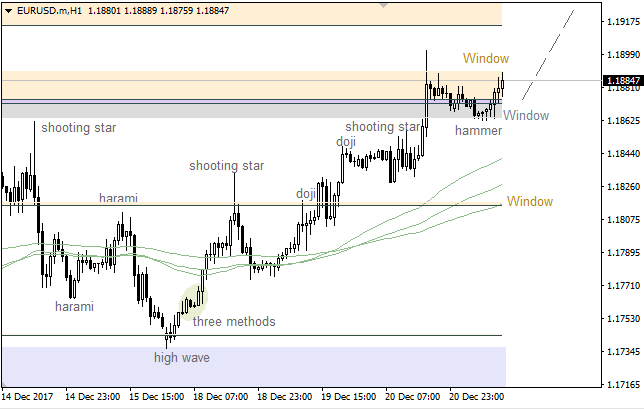
The last "Hammer" pattern pushed the price higher. The main intraday target is the upper "Window". If a pullback from this level happens, there'll be an opportunity to have a decline.
There's still no any reversal pattern on the one-hour chart. Meanwhile, it's likely to have a downward correction in the coming hours. At the same time, bulls will probably try to test the next resistance area afterwards.
On the daily chart, EUR/JPY left the medium-term consolidation range 131.50-133.95 as it traded within Spike and ledge pattern. As a result, the pair resumed bullish trend and the chances of advance to 200% of AB=CD pattern increased. Its situated near 136.
On H1, EUR/JPY formed a Widening wedge. The fact that it went to point 5 means that bulls have total control. Pullbacks to supports may be used for forming long positions.
On the daily chart, USD/JPY bulls managed to conquer resistance at 113.00 and return initiative in their hands. As a result, the odds of reaching 113% target of the inverted junior Shark pattern increased.
On H1, USD/JPY keeps correcting to the wave CD as the Shark pattern is transforming into 5-0. Return of the pair 50% and the following successful test of the diagonal support will increase the risk of decline. On the other hand, increase above 78.6% and 88.6% will allow bulls to continue the rally.
Bulls faced with resistance at 1.1919, so the price is consolidating. The main intraday is the next resistance at 1.1901 - 1.1919. If a pullback from this area happens, there'll be an opportunity to have a decline towards the closest support at 1.1859 - 1.1833.
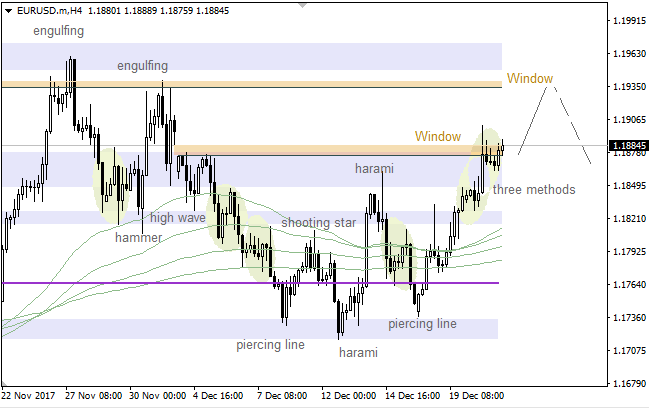
The price is consolidating between the levels 1.1871 - 1.1890. Also, there's a "Pennant" pattern, so it's likely that the pair is going to test the nearest resistance at 1.1914 - 1.1941. Meanwhile, if a pullback from this area happens little later on, bears will probably try to reach another support at 1.1848 - 1.1833.
There's a bullish "Three Methods" pattern, which has been formed on the nearest "Window". So, the market is likely going to test the next "Window" in the short term.
We've got a bullish "Hammer" pattern, which has been confirmed. In this case, it's likely that the pair is going to continue moving up in the direction of the upper "Window" in the coming hours.
There's a "Shooting Star", which has been formed at the last local high. However, this pattern doesn't have confirmation so far. Therefore, we could have just a local bearish correction towards the Moving Averages.
We've got a bearish "High Wave", but confirmation of this pattern is a quite weak. So, we should keep an eye on the 89 Moving Average as the next intraday target. If a pullback from this line happens little later on, there'll be an opportunity to have another bullish price movement.
There's a developing ending diagonal in wave 5, so we're likely going to have a zigzag in wave [iii] in the short term. The main intraday target is +2/8 MM Level.
The price has been rising since a pullback from 1/8 MM Level happens. It's likely that wave [4] ended, so we could have another bullish impulse in wave [5] of iii in the coming hours. In this case, we should keep an eye on 7/8 MM Level as the next target.
Buy 0.7700; SL 0.7680; TP1 0.7760; TP2 0.7790.
Reason: expanding bullish Ichimoku Cloud with rising Senkou Span A and B; a new golden cross of Tenkan-sen and Kijun-sen, but the lines are horizontal; the prices are breaking out the resistance of 0.7680 and may go higher.
Buy 113.00; SL 112.80; TP1 113.60; TP2 114.00.
Reason: expanding bulllish Ichimoku Cloud with rising Senkou Span A; a golden cross of Tenkan-sen and Kijun-sen with rising Tenkan-sen; the prices are tested the main resistance and returned to support of Tenkan-sen.
On the daily chart, EUR/USD created grounds for the realization of the |Head and shoulders pattern. The necessary conditions include a break of support at 1.1805-1.1820 with the following exit of the pair outside of the uptrend channel. On the other hand, renewal of last high above 1.19 will increase the risks of the rallys continuation.
On H1, EUR/USD the exit of the pair outside of the uptrend channel will create grounds for triggering AB=CD pattern. Its 127.2% target is near 1.1670.