Bem vindos ao Fórum do Portal BolsaPT! Inscrevam-se e participem na nossa comunidade, poderão pedir opiniões e Análises Técnicas às vossas acções, colocar dúvidas, aprender, partilhar ideias, ajudar outros, etc. Além das cotações, gráficos, análise técnica interactiva, históricos, terão simulação de carteiras, alarmes, e muito mais virá no futuro. Lembre-se que se pode logar com o seu login CanalForex!
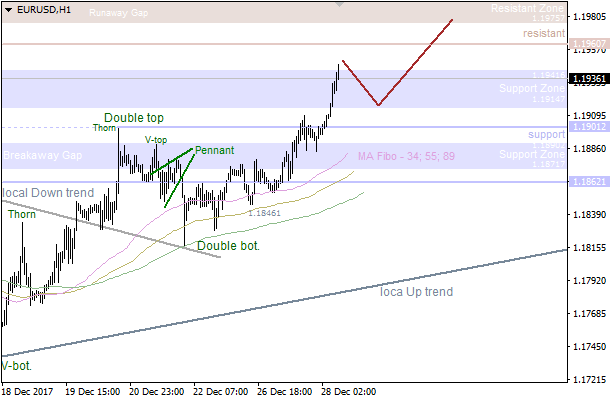
There's a consolidation, which is taking place above the 34 Moving Average. The main intraday target is the next resistance at 1.1975 - 1.2003. If a pullback from this area happens little later on, there'll be an opportunity to have a decline towards the nearest support at 1.1919 - 1.1901.
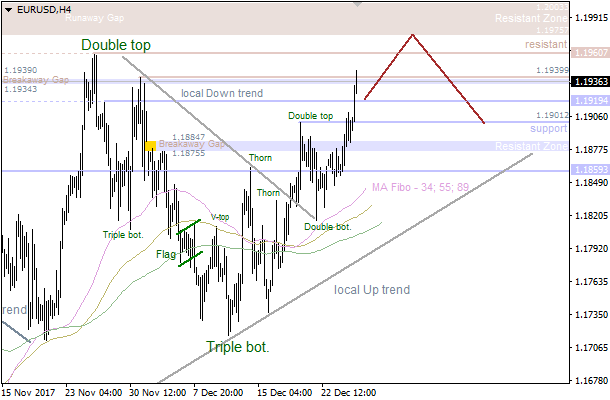
The price went through the resistance area at 1.1914 - 1.1941. However, it's likely to have a correction towards the nearest support at 1.1914. If a pullback from this level happens, we could have an upward price movement towards another resistance at 1.1975 - 1.2003.
The trend is still bullish. The main intraday target is the next resistance at 1.3465 - 1.3519. If a pullback from this level happens, there'll be an opportunity to have a decline in the direction of the closest support at 1.3445 - 1.3419.
The last "Triangle" has been broken, so the price is rising. At the same time, we could have a bearish correction towards the nearest support area at 1.3430, which could be a departure point for another bullish rally.
The upper "Window" is acting as resistance, so there's an opportunity to have a bearish correction towards the last "Three Methods" pattern. If a pullback from this area happens little later on, bulls are likely going to deliver a new local high.
There's a "High Wave" pattern, which is likely going to be confirmed soon. In this case, we could have a downward correction in the coming hours.
We've got a bearish "Hammer" pattern, which hasn't been confirmed yet. Therefore, we should keep an eye on the 21 Moving Average as the next intraday target.
The lower "Window" acted as support, so there's a bullish "Harami" pattern. Under this circumstance, the 55 & 89 are likely going to act as resistance in the short term.
The last "Triangle" has been broken, but the price is consolidating. The main intraday target is the 34 Moving Average. If this line acts as support, bulls are likely going to test the closest resistance at 1.3465 - 1.3519.
The uptrend has acted as resistance, so the price is consolidating. In this case, we're likely going to have a bearish correction in the short term. If a pullback from the closest support happens at 1.3420, we could have just another bullish rally.
On the daily chart, EUR/JPY bulls are trying to continue going up to 200% of AB=CD. Never the less, if bears manage to return the pair inside the previous consolidation range of 131.50-133.95, the risks of a reversal Shakeout-Fakeout pattern will increase.
On H1, after reaching the targets of the Widening wedge and rebound from support at 134, the rally continued. To seal their success, bulls need to renew December high.
On the daily chart, if EUR/USD renews November high, the odds of its getting to 161.8% target of AB=CD will increase. Never the less, if bulls fail to settle above resistance at 1.1965-1.1975, there may be a Top/ Bottom 2B strategy of Victor Sperandeo. Return of the pair to the candles low, at which it has a previous high, is a signal for selling.
On H1, the inability of bulls to keep pushing up increases the risks of a reversal Widening Wedge pattern.
There's a possible "Belt Hold" pattern, which has been formed on the lower "Window". Therefore, the market is likely going to continue rising towards the next "Window".
We still don't have any reversal pattern. However, if a pullback from the nearest resistance arrives little later on, there'll be an opportunity to have a bearish correction.
BITCOIN (BTC/USD)
19:25 01.01.2018
Bitcoin keeps moving below the 200-hour moving average, which has allowed cryptocurrency to weaken in the markets, especially against the US dollar. From the 50% Fibonacci level we have seen that the BTC has encountered resistance, along with the 200 SMA mentioned in the H1 chart, which helps to add pressure to the BTC/USD.
The key support of 11,588 remains intact and is likely to remain that way for a few more days, due to the recovery that has been taking place since the December 30 session. The resistance of 13,618 continues to be key to the development of the trend in Bitcoin, in addition to the Parabolic SAR is reflecting a bearish condition.
What do we expect?
According to our projections in the short term, Bitcoin is going to stay in the corrective stage and still has air to continue with the bearish movement. The closest target is at the low of December 22 at 10,680, which should be fractured so that the crypto-currency falls to the Fibonacci target of -23.6% at 8,507.
GBP/AUD
19:26 01.01.2018
GBP/AUD stays alive in the bearish trend held since several days ago, consolidating its price action below the 200 SMA at H1 chart, which is also offering a dynamic resistance in the pair across the board. The next target to the upside lies at the Fibo target of 50% in 1.7359, at which could trigger sell orders to reach the next downside target at the -23.6% Fibo level at 1.7137.
RSI indicator remains in the neutral territory, pointing to the downside in the short-term.