Bem vindos ao Fórum do Portal BolsaPT! Inscrevam-se e participem na nossa comunidade, poderão pedir opiniões e Análises Técnicas às vossas acções, colocar dúvidas, aprender, partilhar ideias, ajudar outros, etc. Além das cotações, gráficos, análise técnica interactiva, históricos, terão simulação de carteiras, alarmes, e muito mais virá no futuro. Lembre-se que se pode logar com o seu login CanalForex!
Buy 1.2400; SL 1.2420; TP1 1.2260; TP2 1.2220
Reason: bullish Ichimoku Cloud, but falling Senkou Span A; a cancelled golden cross of Tenkan-sen and Kijun-sen with falling lines; the prices are entered inside a Cloud and may going to Senkou Span Bs support.
Buy 1.3900/20; SL 1.3880; TP1 1.4050; TP2 1.4100.
Reason: bullish Ichimoku Cloud with falling Senkou Span A; a new dead cross of Tenkan-sen and Kijun-sen, but the narrow channel Tenkan-Kijun; the prices are falling down to Senkou Span Bs support.
On the daily chart of XAU/USD, bulls managed to defend support at $1324-1328 an ounce. If bears succeed in another attempt to pulls the prices below this level, the risks of a pullback to $1306 and lower will increase. To continue rally towards 127.2% target of AB=CD, gold would need to rise above January high.
On H1, a break of the upper border of an uptrend will increase the odds of the pair going to 88.6% target of the Shark pattern. A pullback, on the other hand, will create grounds for the formation of the Head and Shoulders.
On the daily chart, USD/CAD bulls managed to rise above the upper border of the uptrend channel. As a result, the odds of an inverted Shark pattern with target at 88.6% have substantially increased.
On H1, the probability of USD/CAD pulling back to support levels at 1.2485-1.2510 and 1.2390-1.2410 increased after the pair reached 113% target of the junior Shark pattern. If USD/CAD renews February high, this will create grounds for going to 88.6% target of the senior Shark pattern.
BITCOIN Daily Analytics
08:14 06.02.2018
The price of the worlds main cryptocurrency keeps falling. BTC/USD fell from the $11,600 area where it traded at the end of January to the vicinity of $6,000 on Tuesday, February 6.
Bitcoin is in a firm downtrend. The double top formed on the chart in December and January, suggests that decline may stretch as low as to $4,300. Daily and weekly MACD indicators signal further downside. In addition, BTC/USD broke yesterday below the 200-day moving average for the first time in more than two years. This line will now act as resistance at $7,900. Bitcoin also went below the trend line connecting the lows of January 17 and February 2 (its located in about the same area as the 200-day MA). BTC/USD has to return at least above this area to give bulla a chance to reverse the satiation.
Its clear that the cryptocurrency market is in desperate need of new monetary inflows. Yet, for now the sentiment seems to be negative. Bitcoin market capitalization declined from $294 billion on January 7 to $139 billion on February 5.
Why is Bitcoin falling?
Bitcoins price is affected by negative news flow. Fears of regulatory prohibitions led to the decline in Asian trading volumes. According to local media, China will reportedly block anyone in the country from accessing websites that offer cryptocurrency trading services or initial coin offerings (ICOs).
Bloomberg reported that the heads of CFTC and the SEC will ask the Congress to consider federal oversight for digital-currency trading platforms.
Many major commercial banks announced that they would ban the use of their credit cards to buy Bitcoin and other cryptocurrencies. These banks include JPMorgan Chase, Bank of America, and Citigroup in the United States and Lloyds bank in the United Kingdom.
The markets risk sentiment in general suffered this weak as world stocks experienced big selloffs.
The trend is still bullish, but the price is consolidating. The main intraday target is the next resistance at 1.2456 - 1.2500. If a pullback from this area happens little later on, there'll be an opportunity to have a decline towards the nearest support at 1.2334 - 1.2294.
The Moving Averages have acted as resistance, so there's a "V-Top" pattern. In this case, the pair is likely going to reach the closest support at 1.2384 - 1.2363 in the short term. Meanwhile, if we see a pullback from these levels, bulls will probably try to test the next resistance at 1.2482 - 1.2456.
There's a "Double Top" pattern, which has been confirmed. The main intraday target is the nearest resistance at 1.4082 - 1.4129. These levels could be a departure point for a decline towards the next support at 1.3895 - 1.3834.
Bears faced with support at 1.3944, so the price is consolidating. In this case, bulls are likely going to test the 89 Moving Average in the coming hours. If we see a pullback from this line, there'll be a moment to have a decline towards the nearest support at 1.3944 - 1.3915.
The 34 Moving Average has acted as support, so there's a "Hammer" pattern, which has been confirmed. So, the market is likely going to test the nearest resistance area in the short term.
The 34 & 55 Moving Averages are acting as resistance. Also, there's a "Harami", but confirmation of this pattern isn't enough. So, we could have a local bearish correction and the following bullish price movement afterwards.
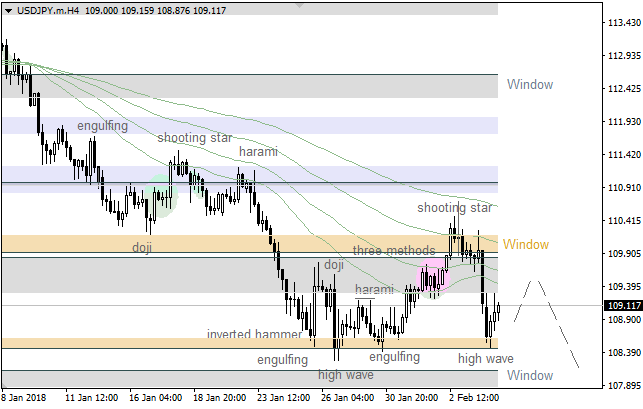
The lower "Window" has acted as support once again, so we've got a "High Wave" pattern. So, we're likely going to have an upward correction soon. If a pullback from the Moving Averages happens little later on, we could have another decline.
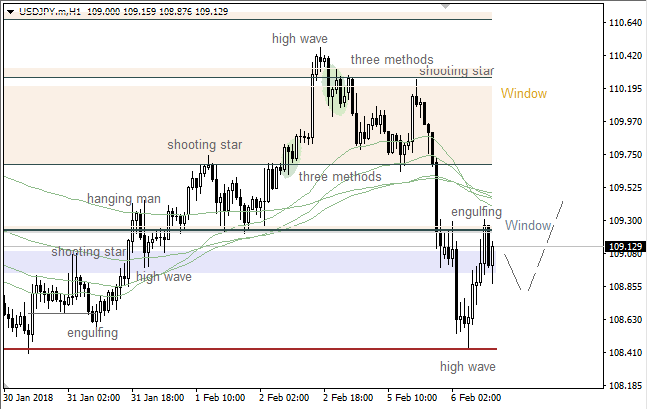
There's a bearish "Engulfing", so the market is likely going to decline during the day. Nevertheless, bulls will probably try to test the Moving Averages afterwards.