Bem vindos ao Fórum do Portal BolsaPT! Inscrevam-se e participem na nossa comunidade, poderão pedir opiniões e Análises Técnicas às vossas acções, colocar dúvidas, aprender, partilhar ideias, ajudar outros, etc. Além das cotações, gráficos, análise técnica interactiva, históricos, terão simulação de carteiras, alarmes, e muito mais virá no futuro. Lembre-se que se pode logar com o seu login CanalForex!
On the daily chart, AUD/USD after reaching 88.6% target of the Shark and a pullback to 23.6% of the wave CD, there was a resumption of a downtrend. The Australian dollar is heading to convergence area at $0.7495-0.7500 (113target of the Shark + 78.6% correction level), at which there are odds of a rebound.
On H1, an advance to 224% target of AB=CD creates an opportunity for aggressive longs. Conservative entry requires confirmation.
There's a pullback from 6/8 MM Level, so wave [i] might have been formed. Therefore, the price is declining in wave [ii]. The main intraday target is 3/8 MM Level, which could be a departure point for wave [iii].
As we can see on the one-hour chart, wave [ii] is taking the form of a zigzag, so wave (c) is likely going to move on towards 3/8 MM Level. In this case, we could have a new local low during the day.
Sell 0.7540; SL 0.7560; TP1 0.7500; TP2 0.7480.
Buy 0.7480; SL 0.7460; TP1 0.7530; TP2 0.7550.
Reason: expanding bearish Ichimoku Cloud with falling Senkou Span A and B; a dead cross of Tenkan-sen and Kijun-sen, falling Tenkan-sen; the prices are made a new lows, but there is a strong support on 0.7480.
Sell 112.50; SL 112.70; TP1 112.00; TP2 111.50.
Reason: expanding bearish Ichimoku Cloud with falling Senkou Span A; a dead cross of Tenkan-sen and Kijun-sen; the market corrected to Kijun-sen and ready to continue existing downtrend.
There's a "Double Top" pattern, which has been confirmed, so the price is consolidating. The main intraday target is the 55 Moving Average. If a pullback from this line happens little later on, bulls will probably try to reach another resistance at 1.1743 - 1.1767.
The price is consolidating between the Moving Averages, so there's a confirmed "Double Bottom" pattern. In this case, the market is likely going to reach the nearest resistance at 1.1767. This level could be a departure point for a decline towards the next support at 1.1712 - 1.1689.
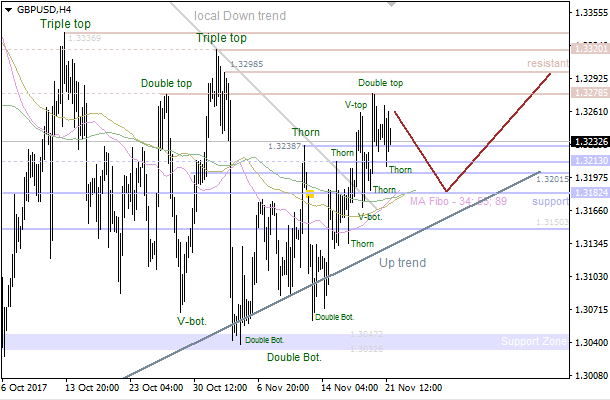
There's a consolidation, which is taking place between the levels 1.3278 - 1.3213. Also, we've got a bearish "Double Top", so the pair is likely going to test the closest support at 1.3201 - 1.3182 in the short term. If we have a pullback from these levels, there'll be an opportunity to have another upward price movement towards the next resistance at 1.3278 - 1.3298.
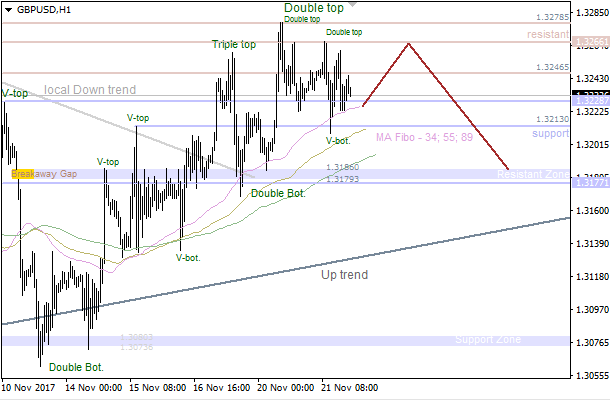
The price is consolidating between the levels 1.3278 - 1.3213. The 34 Moving Average has acted as support, so the market is likely going to test the nearest resistance at 1.3246 - 1.3266. Meanwhile, if we see a pullback from this area, bears will probably try to test the closest support at 1.3186 - 1.3179.
The 34 & 55 Moving Averages are acting as support, but there isn't any reversal pattern so far. In this case, the price is likely going to test the nearest support area once again. If a bullish pattern forms little later on, there'll be an opportunity to have an upward correction.
The price is consolidating between the Moving Averages. At the same time, there's a bearish "High Wave" pattern, so the price is likely going to break the last low in the coming hours.
The upper "Window" is acting as resistance, but there's a bullish "High Wave" pattern. In this case, the market is likely going to test the 55 Moving Average, which could be a departure point for another decline.
There's a bullish "Engulfing", which has been formed at the last local low, but confirmation of this pattern isn't enough. The main intraday target is the 144 Moving Average, which could act as resistance soon.
Wave [ii] is still underway, so we should keep an eye on 3/8 MM level as the next bearish target. If a pullback from this level happens little later on, there'll be an opportunity to have an impulse in wave [iii].
There's a possible leading diagonal in wave (a). In this case, we could have wave (b) during the day. Nevertheless, bears are likely going to deliver wave (c) of [ii] afterwards.
On The daily chart, GBP/USD approached the upper border of the 1.3045-1.3320 range, formed within Spike and ledge pattern. A successful test of resistance at 1.3320 will increase the risks of growth towards 1.3520 and 1.3585 with the following resumption of an uptrend.
On H1, GBP/USD reached the targets of the junior Widening wedge. A pullback to 38.2% of the wave 4-5 with the following return to 23.6% is usually used for buying. The test of resistance at 1.3295 will allow increasing longs.