Bem vindos ao Fórum do Portal BolsaPT! Inscrevam-se e participem na nossa comunidade, poderão pedir opiniões e Análises Técnicas às vossas acções, colocar dúvidas, aprender, partilhar ideias, ajudar outros, etc. Além das cotações, gráficos, análise técnica interactiva, históricos, terão simulação de carteiras, alarmes, e muito mais virá no futuro. Lembre-se que se pode logar com o seu login CanalForex!
There's a "Thorn" pattern, which has been confirmed, so the price is likely going to test the nearest resistance at 1.3549 - 1.3569. If a pullback from this area happens, we could have a decline towards the closest support at 1.3454.
The market is consolidating between the levels 1.3513 - 1.3454. If we see a pullback from the nearest resistance at 1.3513, there'll be an opportunity to have a downward price movement in the direction of another resistance at 1.3549 - 1.3569.
There's still no any confirmed reversal pattern, so all the last candles are bearish. Therefore, the pair is likely going to continue declining towards the nearest support, which could be a departure point for a bullish correction.
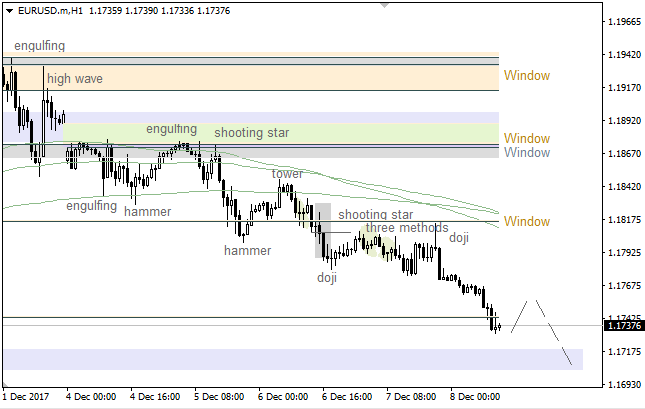
The price has been declining since a pullback from the upper "Window" formed. Considering that there's no any bullish pattern, the pair is likely going to continue declining until any reversal model arrives.
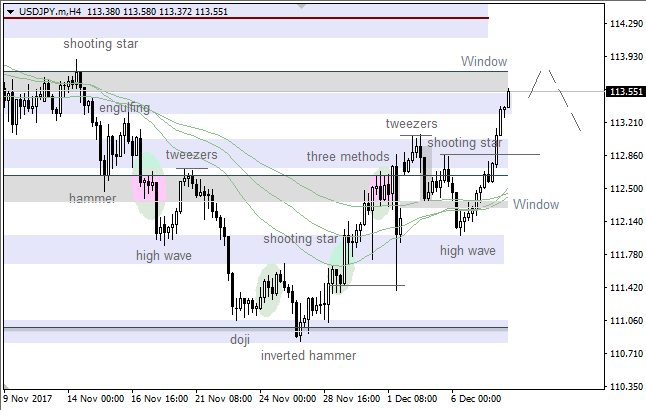
The pair has reached the upper "Window", but there isn't any reversal pattern so far. In this case, the market is likely going to continue moving up until any bearish candle model forms.
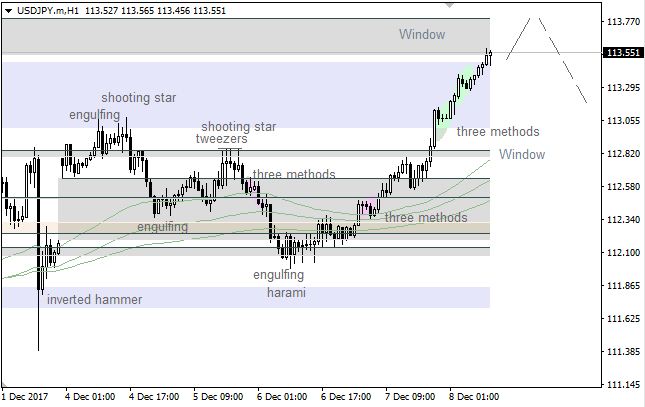
The last two "Three Methods" patterns pushed the market higher. There's no any bearish pattern, so the market is likely going to climb even higher in the coming hours.
Buy 1.3430; SL 1.3410; TP1 1.3490; TP2 1.3530.
Reason: bearish Ichimoku Cloud, rising Senkou Span A; a cancelled golden cross of Tenkan-sen and Kijun-sen, but the lines are horizontal; the prices in a cloudy area but there is a strong support on 1.3380.
Sell 113.50; SL 113.70; TP1 112.80; TP2 112.40.
Reason: expanding bullish Ichimoku Cloud with rising Senkou Span A; a golden cross of Tenkan-sen and Kijun-sen; the prices are under the strong resistance near 113.50/60 and the market is overbought.
On the daily chart, NZD/USD after fourth unsuccessful test of support at 0.6820-0.6825 returned to the upper border of the consolidation 0.6820-0.6910 range. A successful test of resistance at 0.6905-0.6910 will increase the risks of 88.6% target of the junior Shark pattern.
On H1, the inability of bears to lead the pair outside of the uptrend channel points at their weakness. Another test of resistance at 0.6905-0.9610 will lead the pair up to 161.8% target of the Crab pattern.
There's a bullish "Piercing Line", which has been confirmed, so the price is rising. Also, there's no any bearish pattern, which means the price is going to test the nearest resistance. If a pullback from this level happens little later on, there'll be an opportunity to have another decline.
We've got a "Tower" pattern, which has been formed at the last low. Considering that there's no any reversal pattern, the market is likely going to continue moving up towards the Moving Averages in the short term.
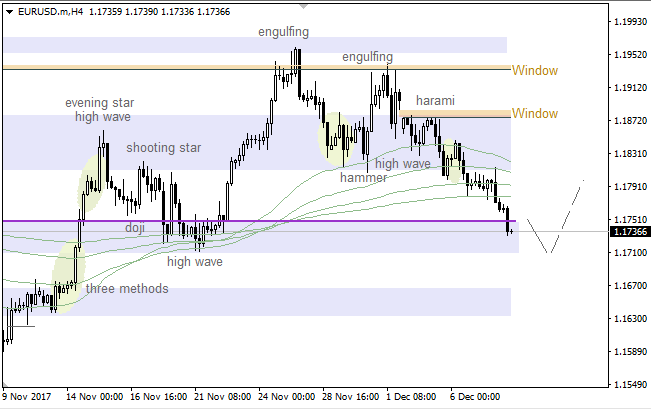
The upper "Window" has acted as resistance, so there's a bearish "Harami" at the last high. Therefore, the pair is likely going to test the 21 Moving Average in the short term. If a pullback from this line happens afterwards, we could have another bullish price movement.
We've got a bearish "Harami", which has been confirmed, so the price is declining. The main intraday target is the 55 Moving Average. If a pullback from this line happens little later on, there'll be an opportunity to have an upward price movement towards the last high.
On the daily chart, a break of XAU/USD below the lower border of a $1266-1288 consolidation range allowed bears to get out. The target of 78.6% of the Gartley pattern is almost reached. The next one is 200% target of AB=CD. As long as gold is below 1266, sellers retain control of the market.
On H1, the exit outside of the descending trend channel with the following test of resistance at $1252 creates grounds for a pullback. It should be used for forming short positions.
On the daily chart, the inability of bears to hold USD/CAD below the lower border of the uptrend channel points at sellers weakness. To restore the uptrend and reach 88.6% target of the Shark pattern, bulls need to conquer resistance at 1.2922.
On H1, return to resistance area at 78.6% and 88.6% of the wave 4-5 of the Widening wedge means that bulls are in control.